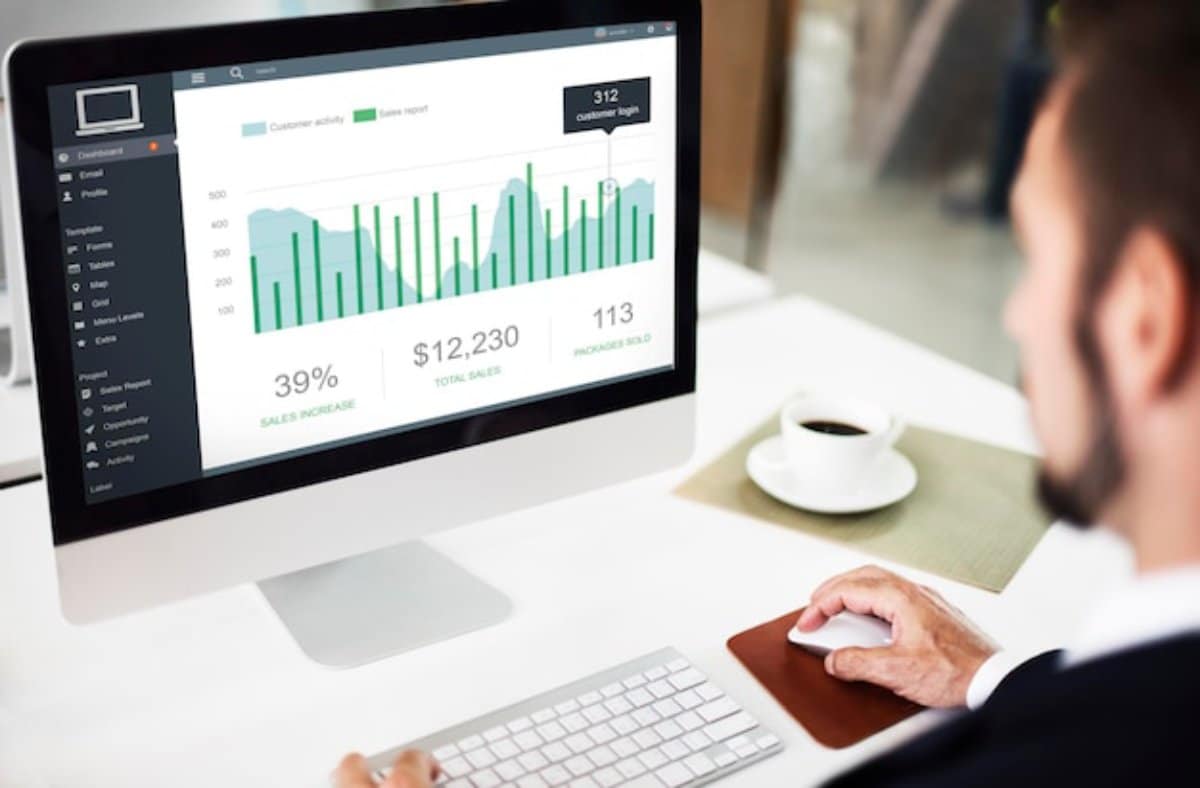
Analysing Payment Data to Improve UX: Harnessing Payment Analytics for Data-Driven UX Improvements
Why Payment Data Is Key to UX Success
Ever wonder why some customers drop off at the last step of checkout while others sail through smoothly? The answer often lies in your payment data. Beyond just showing transaction success or failure, payment analytics offer valuable user behaviour insights that can drive data-driven UX improvements.
In the digital economy, a seamless payment experience can make or break your conversions. By analysing how users interact with your payment gateway—where they hesitate, where they abandon—you can fine-tune the user journey and optimise experiences.
In this guide, we’ll delve into the power of payment data, how to translate it into actionable UX changes, and share practical strategies for turning numbers into meaningful user experiences.
Understanding Payment Analytics: The Goldmine of User Behaviour
What Are Payment Analytics?
Payment analytics involves collecting and interpreting data from your payment systems to understand user interactions, transaction outcomes, and overall performance.
Why Do Payment Analytics Matter for UX?
- Pinpoint Drop-Offs: Identify exactly where users abandon transactions.
- Spot Patterns: Detect trends in user preferences (e.g., preferred payment methods).
- Measure Success Rates: Understand which factors improve or hinder successful payments.
By leveraging these insights, you can make data-driven UX improvements that directly impact your bottom line.
Key Payment Metrics to Analyse for UX Improvements

1. Payment Success Rate
- What It Tells You: The percentage of attempted transactions that succeed.
- Why It Matters: A low rate signals technical issues or user friction.
2. Cart Abandonment Rate
- What It Tells You: The proportion of users who exit before completing payment.
- Why It Matters: Highlights where the payment flow might be too complex or untrustworthy.
3. Preferred Payment Methods
- What It Tells You: The payment options users choose most often.
- Why It Matters: Ensures you offer relevant, user-friendly choices.
4. Transaction Time
- What It Tells You: The average time taken to complete a payment.
- Why It Matters: Longer times can indicate friction points or performance issues.
5. Failed Transactions Breakdown
- What It Tells You: Categorises reasons for payment failures (e.g., declined cards, timeouts).
- Why It Matters: Helps you resolve technical or usability issues.
How to Use Payment Analytics for UX Optimisation
1. Identify High-Friction Points
- Action: Use heatmaps or session recordings alongside payment analytics to visualise user behaviour.
- Example: If users frequently abandon after selecting a payment method, review that stage for usability issues.
2. Optimise Payment Method Offerings
- Action: Analyse which methods users prefer based on user behaviour insights.
- Example: If mobile users lean toward Apple Pay or Google Pay, prioritise these options.
3. Reduce Transaction Time
- Action: Identify and eliminate steps that slow down the process.
- Example: Introduce autofill options or streamline address inputs.
4. Improve Error Handling and Messaging
- Action: Review failed transaction data for common issues.
- Example: If card declines are high, provide clearer error messages and suggestions (e.g., try another card).

5. Test and Iterate Based on Data
- Action: Use payment analytics to guide A/B tests for interface tweaks.
- Example: Test different layouts for payment options to see which reduces abandonment.
Real-World Scenario: Leveraging Payment Data to Enhance UX
An online learning platform noticed a dip in mobile conversion rates despite steady traffic. Using payment analytics, they discovered that mobile users faced longer transaction times due to cumbersome address forms and a lack of digital wallet options.
By simplifying forms, adding Google Pay, and optimising button sizes for mobile, they reduced average transaction time by 35% and increased mobile conversions by 20%.
This case demonstrates how data-driven UX improvements can directly impact performance.
Best Practices for Analysing Payment Data
1. Segment Your Data
Break down data by device type, geography, or user demographics.
- Benefit: Uncovers unique friction points across different user segments.
2. Set Benchmarks and KPIs
Track metrics like success rate and abandonment rate over time.
- Strategy: Use these benchmarks to measure the impact of UX changes.
3. Integrate with Broader UX Data
Combine payment analytics with heatmaps, session replays, and user surveys.
- Outcome: Provides a holistic view of the user journey.
4. Collaborate Across Teams
Work with marketing, product, and engineering teams to interpret data and implement changes.
- Tip: Align on shared goals for user experience testing.
Comparing Tools for Payment Analytics
| Tool | Key Features | Suitable For | Pricing |
| Google Analytics | E-commerce tracking, conversion rates | Small to mid-sized businesses | Free/Paid tiers |
| Stripe Dashboard | Payment data, success/failure metrics | Businesses using Stripe | Free |
| Mixpanel | User behaviour insights, funnels | SaaS, mobile apps | Paid plans |
| Hotjar | Heatmaps, session recordings | E-commerce, SaaS | Paid plans |
These tools support payment analytics and broader user behaviour insights.
Trends in Payment Data and UX for 2025
1. AI-Powered Insights
AI tools analyse payment analytics and suggest UX improvements.
2. Real-Time Behavioural Tracking
Instantly adjust payment flows based on live user behaviour.
3. Hyper-Personalised Payment Experiences
Tailor payment interfaces based on user history and preferences.
4. Voice-Activated Payment Interfaces
Integrating voice technology for smoother, hands-free payments.
Keeping up with these trends ensures your data-driven UX improvements remain effective.
Conclusion: Transform Payment Data into UX Gold
Your payment analytics are more than numbers—they’re a window into your customers’ experiences. By harnessing these user behaviour insights, you can make data-driven UX improvements that enhance satisfaction, reduce friction, and boost conversions.
Analyse where users stumble, iterate based on data, and stay agile with emerging trends to ensure your payment process remains seamless and competitive.
Ready to optimise your payment UX? Share your insights or questions below, and subscribe for more on enhancing user experiences with payment analytics!


